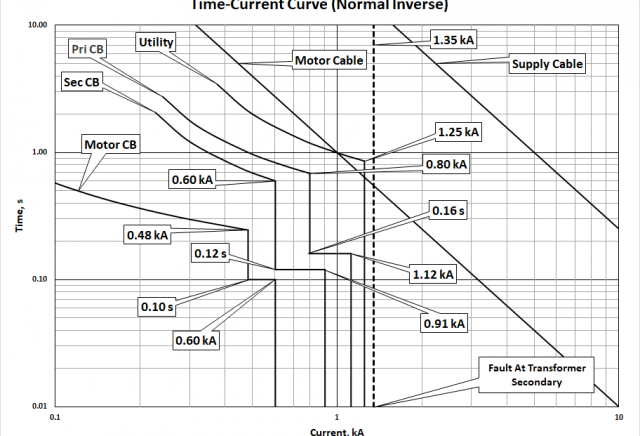
This tutorial serves a guide for the creation of time-current curves using Excel 2013. The user is expected to have at least an intermediate level of knowledge in the usage of aforementioned software else it will be difficult to understand the procedures presented herein. Calculating fault currents is likewise beyond the scope of this document.
In 2008, I have created some articles on the creation of time-current curves using Excel 2003.
- Creating Coordination Curves with Excel (Pangonilo, 2008) [1];
- Time-current Curves with Excel Part II (Pangonilo, 2008) [2];
- Time-current Curves with Excel Part III (Pangonilo, 2008) [3];
- Time-current Curves with Excel Part IV (Pangonilo, 2008) [4].
The steps mentioned in above tutorials may not be applicable anymore with the newer versions of Excel particularly if you are a beginner. This tutorial is an update of those tutorials combined into single article complete with a downloadable pdf. While the 2008 tutorials referred to the IEC 2 60255- 3:1989, this tutorial was updated to IEC 60255-151:2009 which is the current revision of the standard and supersedes IEC 60255-3:1989.
To be able to follow through process of this tutorial, familiarity with the use of Excel 2013 is necessary particularly with the creation of graphs. Without this knowledge, it will be very difficult to understand the steps provided herein.
The minimum requirements of this tutorial are the following
• You have MS Excel - at least MS Excel 2013 or higher versions;
• You know how to use MS Excel;
• You know how to create graphs.
If you do not have the skills listed, Excel online tutorials are available online. Try this link.
Performing protective devices coordination is always a part of our tasks as Electrical Engineers. You may use ETAP, SKM Power Tools or any Power System Analysis software to do the job, if your company has the money to buy the software. What matters most however is the technical know- how in using the sophisticated power system analysis software.
The objective of this tutorial is to guide the Electrical Engineer to create coordination curves for any particular application. This tutorial also aims to provide tips during the process.
Calculating fault–currents are beyond the scope of this tutorial.
The complete tutorial in pdf form with attached excel worksheet is available here.
Update: A single column version of the tutorial can be downloaded here
